Screen Shot 2020-02-16 at 2.49.53 PM

The Noise of Growing Together: From a Scattered Network to a Connected Community

A well-known Bahraini proverb says “one hand does not clap” which implies the need for coming together in order to achieve an impact that makes some noise. In social impact settings, similarly, an organization or program singlehandedly can’t make a significant impact in solving the complexity of social challenges and create large-scale change. At the fifth annual social ventures summit, we were motivated to unite socially-conscious key-players who share a passion for impact-driven work.

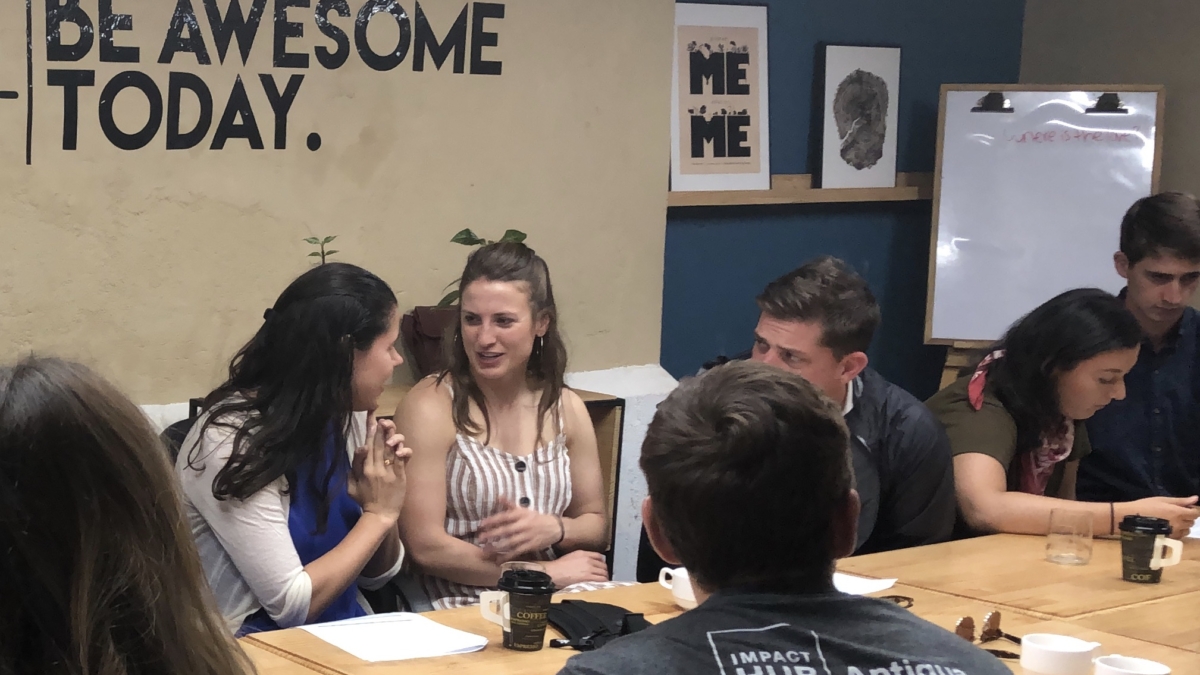
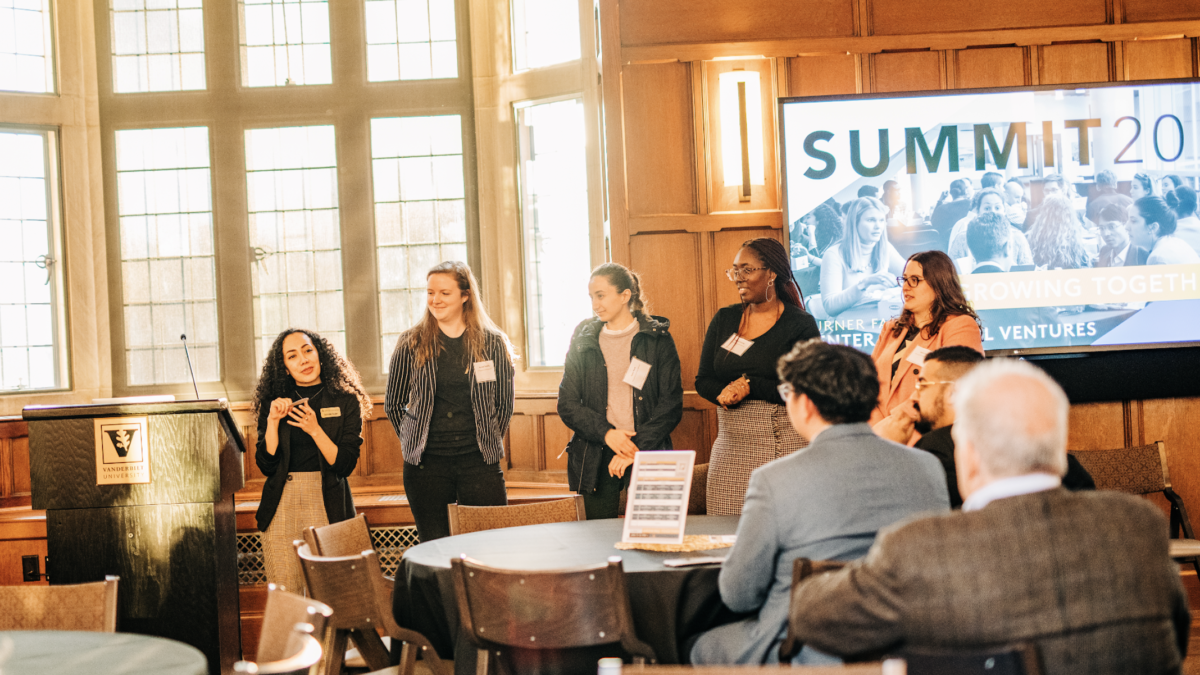
Each year, influential and passionate change-makers gather at Vanderbilt University to exchange ideas and activate solutions during the Annual Social Change Summit. The summit is a premier platform for advancing long-lasting solutions and connections. Under this year’s theme of “Growing Together”, the summit convened innovative and ambitious practitioners to challenge common entrepreneurial approaches, promote networking and foster a culture of engagement. Our mission is to accelerate community-wide growth by uniting strategic key-players in a collaborative pursuit of large-scale impact.

After the summit, I wanted to understand how the network of participants is connected. I was curious: in what ways did the summit affect turning individuals into a network? Who formally connected during the summit and when did they connect? In what ways did they connect? What in the format of the summit helped in creating those connections? In order to do that an x-ray of the relationships amongst participants (a network map) is needed. A post-event survey was used to collect binary and categorical data from the summit participants about the relationships they made then a system mapping visualization tool was used to create network maps.

The network map revealed how the summit connected a scattered, fragmented network into a denser, busier network. The visual depiction also highlighted top connectors within the network who can influence the flow of information and communication and an algorithm unearthed 6 groups of individuals who are predicted to continue connecting together. A presentation reporting an overview of the mapping’s highlights can be found here. 

Finally, it excites me how the fifth annual social ventures summit gathered 120+ participants from 12 universities across 7 states and 20 cross-sectoral speakers & moderators. I am curious to see how the network will grow over time and how the story of the network can be rendered by continuing to trace the relationships between the summit’s participants and capturing periodical snapshots of the network. What echoing noise will this interconnected group of change-makers make?

References

fullsizeoutput_1b64

Entrepreneurship Ecosystem Mapping in Guatemala [Consulting Project]

In recent years, the role of market-based enterprises has gained importance in economic development. Social enterprises have proved to be driving engines for job creation, inclusive growth, and overall social and economic development. Exploring this emerging field and providing students with opportunities to gain insights about it has been the mission of The Turner Family Center for Social Ventures at Owen Graduate School of Management.

Our team started by developing an understanding of the entrepreneurial environment and investment climate in Guatemala by mapping key ventures and entrepreneurial players, exploring the evolving culture and attitudes, and understanding the interactions between various players. We designed a partner profile checklist and identified the main collaboration goals which helped us to develop a scorecard and partnership recommendations.

Our final deliverables included a market assessment on social ventures and impact investors, connections and recommendations for future partnerships with social entrepreneurs, and a review highlighting challenges and opportunities in Guatemala.

Project Team: Megan Skaggs & Zahraa Dagher

VAuLDHRTQHuvjZjDOQeBcA

Data Viz for Business Analysis

Making sense of large amounts of data can be challenging. Where to start? Which tools to use for analysis? How to best present findings? The concept of using graphics to understand data has been present for centuries. Today, Technology enabled the processing of large amounts of data in a remarkably speedy fashion. Additionally, the rise of Big Data presents great opportunities to understand the business, identify influencing indicators, and forecast predictions. Nonetheless, these opportunities cannot be reaped without unlocking complex data through data analysis and visualization. The Problem With over 90,000 offenses in Denver that are forecasted to rise in the coming years, our team inspected the crime status in the city to find potential patterns, find trends, and make recommendations for policing efforts. The Process  Our team started by understanding the needs of this data analysis and determining the principal questions that we want to answer and absorbing the open-source dataset that we are working with. After laying the groundwork for data visualization, we used Tableau to depict information visually. The Solution Our team took the roles of consultants and analysts to provide the valuable insights about crime in Denver. We have developed multiple dashboards that involve interactive graphs and charts which lead us to gain business insight. We applied principles of color theory, human perception and effective data storytelling to analyze data and present findings.
Project Team: Geming Liu, Hannah Staller, Ian Nelson, Jocelyn Kirk, Zahraa Dagher
Screen Shot 2019-04-20 at 7.33.38 PM

Consulting to Activate Strategies [Social Ventures Project]

Activating an organization’s strategy in its program design and evaluation is not an easy task. Our team was working with WELCOMMON, a social cooperative in Greece, to improve WELCOMMON’s programs design and implementation strategies.

The Problem

Our team was supporting WELCOMMON’s Social Programs team which consists of 2 staff members alongside 30+ volunteers that work with WELCOMMON over different periods of times. The volunteers intake fluctuates over the year which created inefficient utilization of both the staff and volunteers’ efforts. 

The Process 

To help WELCOMMON in achieving their vision, our team started by gaining a better understanding of the refugee crisis in Greece, and analyzing the organizational performance using tools like the Business Model Canvas, Theories of Change and Logic Modeling. Theories of Change were popularized in the 90s as means to capture complex initiatives. Theories of Change were essential in articulating underlaying factors that lead to long-term consequences. Meanwhile, Logic Models enabled us to illustrate WELCOMMON programs’ components graphically, and identify outcomes, inputs and activities.

The Solution

In our initial meetings with WELCOMMON, we developed an overarching journey map and timeline to communicate the desired change management strategy to bring the social programs’ transformation to life. We broke down the profiles of stakeholders who interact with refugees into 3 segmentations, proposed an improved organizational structure, and designed a training program with compelling messaging and key stakeholder communications.

More about our experience with WELCOMMON

Project Team: Ben Burkeen, Shatakshi Gupta, Tiffany Vazquez, and Zahraa Dagher

DTAC

The Largest Public Speaking Conference in MENA

“You will be the Chairperson to the humorous speech contest.” I read those email lines and I jumped into a happy dance! YAY ME! I was thrilled and privileged to be selected as a Chairperson for the largest Speaking Conference in MENA, DTAC 2017.

A sudden rush of nervousness stopped my happy dance. Standing in front of an audience of proficient speakers and prominent Toastmasters was frankly a scary thought. As if that wasn’t challenging enough, I was also expected to be funny while being among the top humorous speakers of the region. ‘You can do it, Zahraa’ I told myself. I had to dust off my self-doubt and pull out some belief reflecting back on my experience. I reminded myself that I just won seven trophies within my first five months of joining Toastmasters, that must count for something, right?

On the day of the event, I put on my new lipstick and same old smile, and I took a deep breath telling myself that I’ll just have fun. I stepped on the stage with my cheat sheets in my hands, ready to show what I practiced. I started delivering what I rehearsed until the contest’s Chief Judge approached the podium and told me to stop and wait because one of the judges is not in the hall yet. Suddenly I found myself facing the audience’s puzzled eyes with no cheat sheets to answer from. Those seconds of silence felt like ages. “Have fun“, an inside voice reminded me. A moment later, I found myself casually speaking, cracking jokes, certainly having so much fun.

It was an altering moment when I decided to stop worry and enjoy my time instead. We always need to remember to clear out our doubts with some self-belief and a lot of fun.