Making sense of large amounts of data can be challenging. Where to start? Which tools to use for analysis? How to best present findings? The concept of using graphics to understand data has been present for centuries. Today, Technology enabled the processing of large amounts of data in a remarkably speedy fashion. Additionally, the rise of Big Data presents great opportunities to understand the business, identify influencing indicators, and forecast predictions. Nonetheless, these opportunities cannot be reaped without unlocking complex data through data analysis and visualization.
The Problem
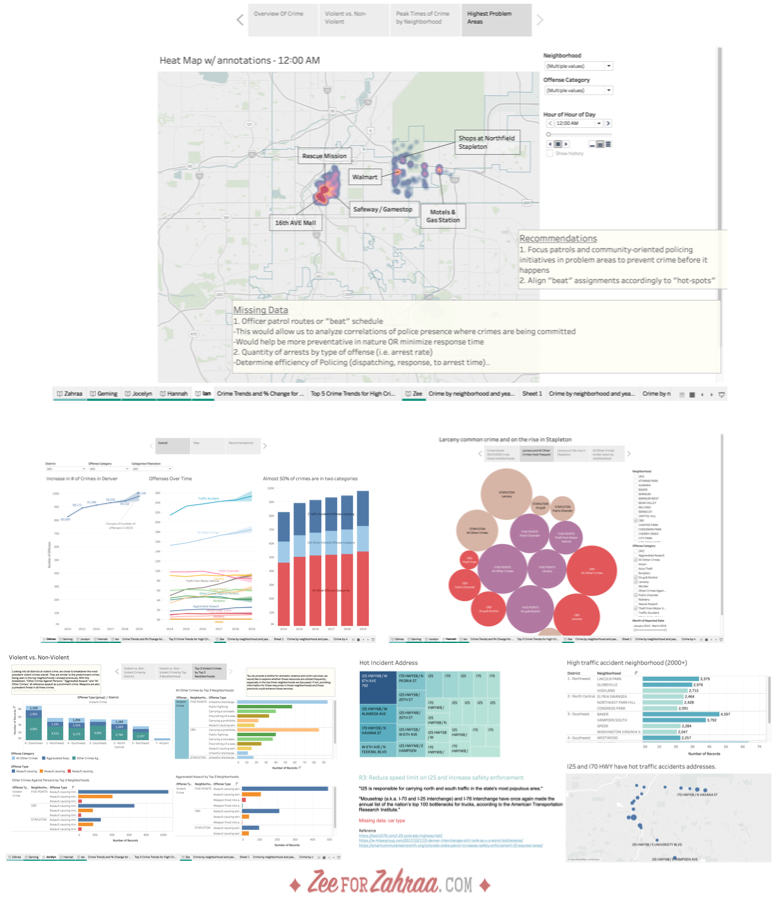
With over 90,000 offenses in Denver that are forecasted to rise in the coming years, our team inspected the crime status in the city to find potential patterns, find trends, and make recommendations for policing efforts.
The Process
Our team started by understanding the needs of this data analysis and determining the principal questions that we want to answer and absorbing the open-source dataset that we are working with. After laying the groundwork for data visualization, we used Tableau to depict information visually.
The Solution
Our team took the roles of consultants and analysts to provide the valuable insights about crime in Denver. We have developed multiple dashboards that involve interactive graphs and charts which lead us to gain business insight. We applied principles of color theory, human perception and effective data storytelling to analyze data and present findings.
Project Team: Geming Liu, Hannah Staller, Ian Nelson, Jocelyn Kirk, Zahraa Dagher